SAN ANGELO, TX - This year's Your Driving Cost (YDC) study reveals that the total cost to own and operate a new vehicle is $12,297 or $1,024.71 monthly, an increase of $115 from 2023, according to AAA Texas.
The leading cost culprits for buyers are depreciation and finance charges. With automakers adding more vehicle choices with major redesigns, AAA advises buyers to consider various factors associated with owning and operating a new vehicle to fully understand ownership costs.
"Buying a new car can be exciting," stated Greg Brannon, AAA's director of automotive research. "But consumers should fully understand all the costs of owning and operating a new vehicle from purchase to resale.”
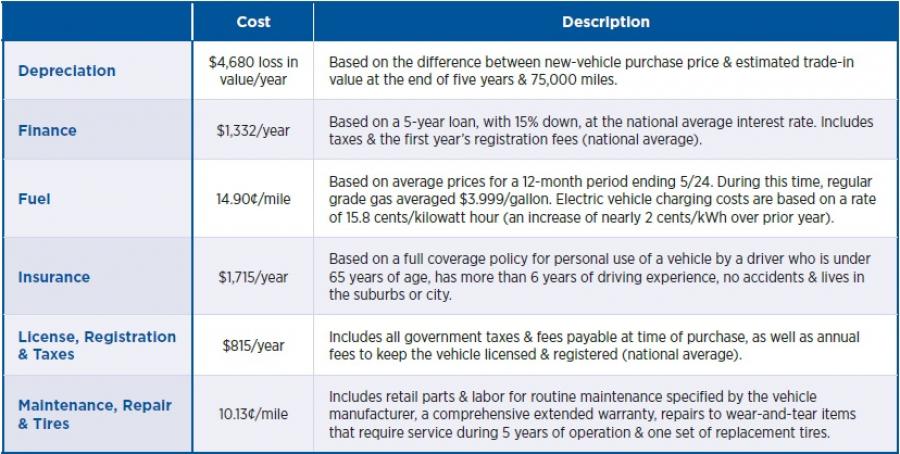
Depreciation, the difference between the car's value upon purchase and when sold, is the most significant cost category associated with vehicle ownership in this year’s analysis. On average, cars in this year's YDC lose a staggering $4,680 annually. The popularity of oversized vehicles with cutting-edge features has led to an increase in new car prices, which results in higher depreciation costs.
Other factors driving new ownership costs:
- Car Prices—The sales-weighted average manufacturer's suggested retail price (MSRP) for new vehicles in the study is $38,883, an increase of 0.7% over last year. It’s important to note the MSRP may not always reflect the actual purchase price and can vary based on demand. The average MSRP for each vehicle category is weighted based on its share of the total vehicle sales. This means higher-selling categories, such as pick-up trucks, have a larger impact on the average value.
- Finance Charges—A higher sticker price directly impacts finance costs, with this year's vehicles incurring an average annual finance charge of $1,332, a 6% increase from the previous year. *Please note: Sticker price increase may be due to vehicles replaced in YDC.

AAA Texas: The Price of New Car Ownership Continues to Climb

AAA Texas: The Price of New Car Ownership Continues to Climb
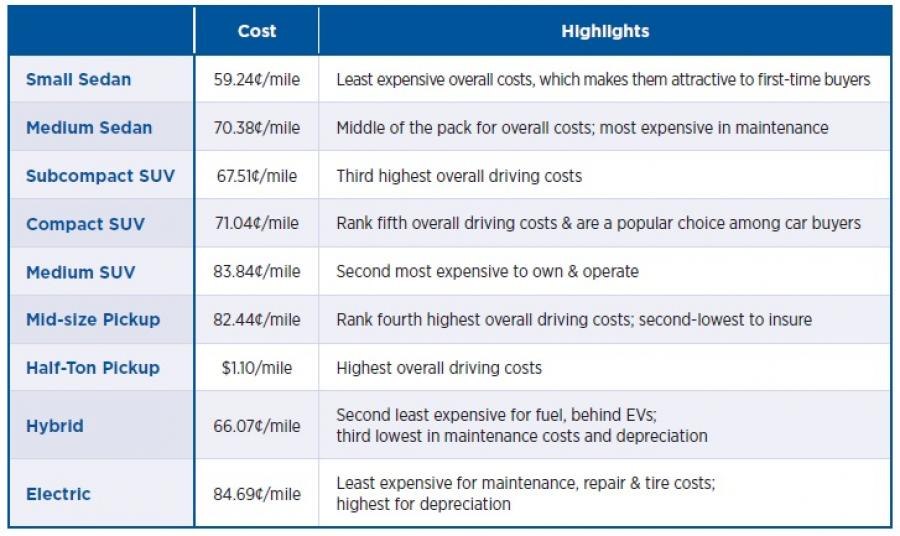
This year, EVs have the second-highest total ownership costs due to depreciation, purchase prices, and finance charges. Preferences have shifted to more expensive and larger EVs, resulting in growth in these cost categories.
EVs have the lowest fuel cost of any vehicle type, based on a national average electricity price of 15.9 cents per kilowatt hour (kWh). Plus, because of their design and powertrain, EVs have the lowest maintenance costs.
Hybrid vehicles have the second lowest total ownership costs behind small sedans. They benefit from excellent fuel economy and low maintenance costs and rank near the middle in depreciation, financing, and insurance costs. According to this year’s EV consumer sentiment survey, one in three U.S. adults (31%) say they would be “very likely” or “likely” to buy a Hybrid.
“Hybrid vehicles are a reasonable, affordable option for those who want to try the benefits of electrification,” said Brannon. “Hybrids benefit from excellent fuel economy, low maintenance costs, depreciation, and insurance – making them an affordable option for car buyers.”
Car Buying Advice
With higher purchase prices impacting other cost categories, it’s important to remember these car-buying tips when researching all options:
- Create a monthly or annual budget and factor in ownership and operating costs before purchase.
- Keep each transaction and negotiation separate from the other – the cost of the car, the finance rate, and the trade-in value.
- Obtain pre-approval from a financial institution (e.g., Bank, Credit Union, AAA, etc.) before discussing finance rates with the car dealer to ensure you get the best lending rate available to you.
- There are quite a few options (online and in-store) available to consumers when considering where to buy a used vehicle besides a dealership. Visit your local AAA, which may offer discounts for members.
Additional AAA Support:
- Your Driving Costs calculator: Customizable digital tool that offers cost analyses for specific vehicles by category, new and used cars (up to five model years back).
- AAA Car Guide: Annual guide that ranks and rates vehicles with the latest automotive technology.
- AAA’s Car Buying Program: Comparisons for consumers to use while car shopping and buying.
- EV 101 (Digital Buyer's Guide): Resource and educational guide for consumers to use while electric vehicle shopping and buying.
- Repair Cost Calculator: Repair costs breakdown for parts and labor, including AAA member discounts available when visiting AAA Approved Auto Repair facilities.
Methodology:
Overall YDC Analysis
AAA uses a proprietary methodology to calculate the costs of owning and operating a new car in the United States. Data is gathered from various sources, including Vincentric LLC, and incorporates standardized criteria to estimate the costs of using a new vehicle for personal transportation over five years and 75,000 miles of ownership. The use of standardized criteria ensures that AAA estimates are consistent when comparing the driving costs of different vehicle types. Actual driving costs will vary based on driving habits, location, operating conditions and other factors.
AAA evaluated nine categories of vehicles – consisting of 45 models – to determine a new vehicle’s average annual operating and ownership costs. AAA selects top-selling, mid-priced models and compares them across six categories: fuel, maintenance/repair/tire costs, insurance, license/registration/taxes, depreciation, and finance charges. The study assumes a five-year ownership period, with the vehicle being driven 15,000 miles/annually (or a total of 75,000 miles).
EV & Hybrid Cost Comparisons:
AAA evaluated four categories of EVs and Hybrids – consisting of 11 total models – compared them across six cost categories: fuel, maintenance/repair/tire costs, insurance, license/registration/taxes, depreciation, and finance charges. The study assumes a five-year ownership period, with the vehicle being driven 15,000 miles/annually (or a total of 75,000 miles).
Due to a limited number of models with significant sales available in many vehicle categories, only four vehicle categories were selected (medium sedans, compact and medium SUVs, and pickup trucks) for analyzation and comparison to those corresponding ICE categories. Therefore, overall results from the EV/Hybrid analysis cannot be directly compared to the overall results from the regular YDC study.
Subscribe to the LIVE! Daily
Required


Post a comment to this article here: