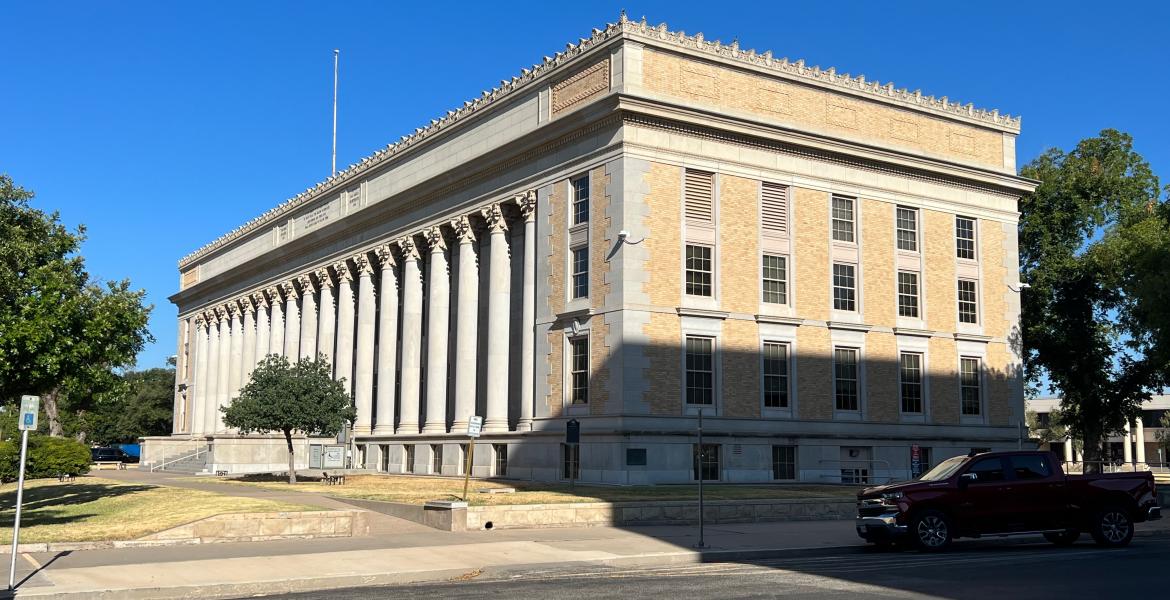
With the guarantee of a new governor, congressional and senate races, as well as a couple of local offices being decided, Tom Green County voters braved wet weather to cast their ballots on Election Day, 2014.
Several voters who went to the new Vote Centers after work reported crowded conditions and some said it took up to 30 minutes to complete the process.
After balloting, voters said they were lobbied hard by poll workers who were anxious for them to fill out a survey that would provide feedback to officials on the new Election Day setup.
Election Administrator Vona McKerley said turnout was higher than anticipated at some locations, and people were still voting at San Angelo Community Hospital as of 8 p.m., as more than 1,000 people had chosen that location to cast ballots.
McKerley said they held some machines and poll workers in reserve, in order to dispatch them--as needed--to locations that had higher-than-anticipated turnout.
Some voters who are eligible to vote in the Christoval ISD trustee race have said they were not able to cast votes in that contest, and McKerley said that was possible, but if they didn't speak up at the polls, there was little they could do about it, after the fact. Commissioner Rick Bacon said they would check into "any irregularities" when canvassing the votes.
Several major races have been called as of 8:30 p.m., with victories for new Governor Greg Abbott, Lt. Governor Dan Patrick, incumbent U.S. Senator John Cornyn and incumbent U.S. Congressman Mike Conaway.
Locally, County Commissioner for Precinct 3, Rick Bacon led early voting, along with Justice of the Peace for Precinct 1 Kay Longest.
| Candidate
| Early/Absentee Voting |
Election Day Voting |
Total |
|
County Commissioner Pct. 3
|
| Rick Bacon (R) |
1,791 |
1,967 |
3,758 |
| Cidia Flores (D) |
390 |
344 |
734 |
|
Tom Green County Justice of the Peace, Precinct 1
|
| Kay Killam Longest (R) |
921 |
850 |
1,771 |
| Jo Ann R. Martinez (D) |
521 |
461 |
982 |
Christoval ISD Board of Trustees
|
| Shawn Nanny |
147 |
313 |
460 |
| Paul Moore |
34 |
129 |
163 |
| Mary Ann Cochran |
113 |
245 |
358 |
| Drew Workman |
54 |
177 |
231 |
| Keith Doering |
70 |
259 |
329 |
| Lynn Dye |
82 |
238 |
320 |
| Candidate
| Local Votes |
Statewide |
Percent |
|
U.S. Senator
|
| John Cornyn (R) |
14,586 |
2,843,306 |
61.59 |
| David M. Alameel (D) |
2,950 |
1,584,718 |
34.33 |
| Rebecca Paddock (L) |
507 |
132,814 |
2.87 |
Emily Sanchez (Grn) |
182 |
54,071 |
1.17 |
| Candidate
| Local Votes |
Statewide |
Percent |
|
U.S. Rep. District 11
|
| Mike Conaway (R) |
15,009 |
107,752 |
90.27 |
| Ryan T. Lange (L) |
1,879 |
11,607 |
9.72 |
| Candidate
| Local Votes |
Statewide |
Percent |
|
Governor
|
| Greg Abbott (R) |
14,624 |
2,778,461 |
59.29 |
| Wendy R. Davis (D) |
3,549 |
1,821,494 |
38.87 |
| Kathie Glass (L) |
235 |
66,045 |
1.4 |
Brandon Parmer (Grn) |
63 |
18,369 |
0.39 |
| Candidate
| Local Votes |
Statewide |
Percent |
|
Lt. Governor
|
| Dan Patrick (R) |
14,179 |
2,707,566 |
58.18 |
| Leticia Van de Putte (D) |
3,600 |
1,799,505 |
38.66 |
| Robert D. Butler (L) |
492 |
119,076 |
2.55 |
Chandrakantha Courtney (Grn) |
70 |
27,544 |
.59 |
| Candidate
| Local Votes |
Statewide |
Percent |
|
Attorney General
|
| Ken Paxton (R) |
14,037 |
2,726,491 |
58.85 |
| Sam Houston (D) |
3,741 |
1,759,251 |
37.97 |
| Jamie Balagia (L) |
459 |
117,491 |
2.53 |
Jamar Osbourne (Grn) |
76 |
29,313 |
.63 |
| Amendment
| Local Votes |
Statewide |
Percent |
|
Proposition 1 (Rainy-Day money for roads)
|
| For (in favor) |
12,262 |
3,190,416 |
79.78 |
| Against (not in favor) |
2,593 |
808,412 |
20.21 |
| Candidate
| Local Votes |
Statewide |
Percent |
|
Comptroller (74% reporting)
|
| Glenn Hegar (R) |
13,944 |
2,682,274 |
58.41 |
| Mike Collier (D) |
3,580 |
1,728,751 |
37.64 |
| Ben Sanders (L) |
599 |
136,159 |
2.96 |
Deb Shafto (Grn) |
146 |
44,683 |
.97 |
| Candidate
| Local Votes |
Statewide |
Percent |
|
Commissioner, Land Office
|
| George P. Bush (R) |
14,425 |
2,809,778 |
60.70 |
| John Cook (D) |
3,184 |
1,633,735 |
35.29 |
| Justin Knight (L) |
588 |
125,657 |
2.71 |
Valerie Alessi (Grn) |
138 |
59,588 |
1.28 |
| Candidate
| Local Votes |
Statewide |
Percent |
|
Commissioner of Agriculture
|
| Sid Miller (R) |
14,008 |
2,683,005 |
58.64 |
| Jim Hogan (D) |
3,460 |
1,683,363 |
36.79 |
| David Palmquist (L) |
547 |
131,633 |
2.87 |
Kenneth Kendrick (Grn) |
102 |
77,039 |
1.68 |
| Candidate
| Local Votes |
Statewide |
Percent |
|
Railroad Commissioner
|
| Ryan Sitton (R) |
13,891 |
2,669,145 |
58.32 |
| Steve Brown (D) |
3,488 |
1,669,580 |
36.48 |
| Mark A. Miller (L) |
582 |
144,472 |
3.15 |
Martina Salinas (Grn) |
263 |
92,846 |
2.02 |
| Candidate
| Local Votes |
Statewide |
Percent |
|
Chief Justice, Supreme Court
|
| Nathan Hecht (R) |
14,216 |
2,740,425 |
59.62 |
| William Moody (D) |
3,405 |
1,715,167 |
37.31 |
| Tom Oxford (L) |
587 |
140,379 |
3.05 |


Post a comment to this article here: